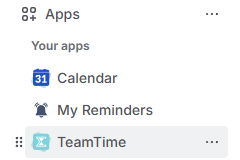
Welcome to the TeamTime for Jira user guide! To get started, navigate to the Apps menu inside Jira and select the app name:
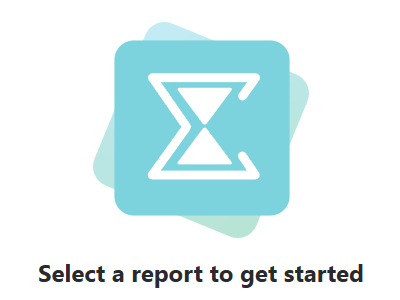
Once you arrive at the main page, you will see the initial selection screen:
To build your first report, go to the sidebar on the right side of your screen and click the Create new report button:
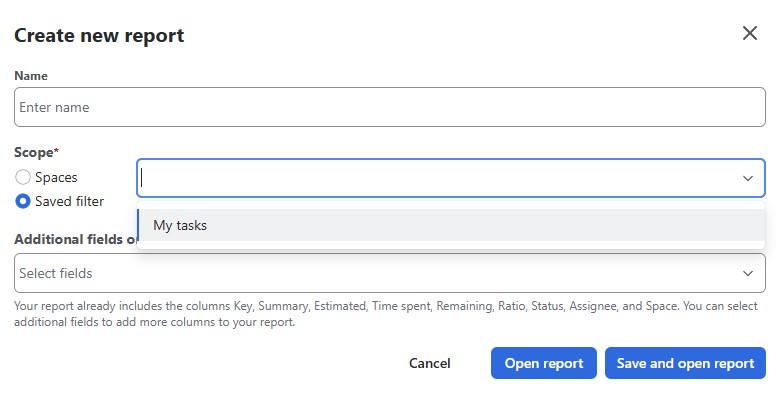
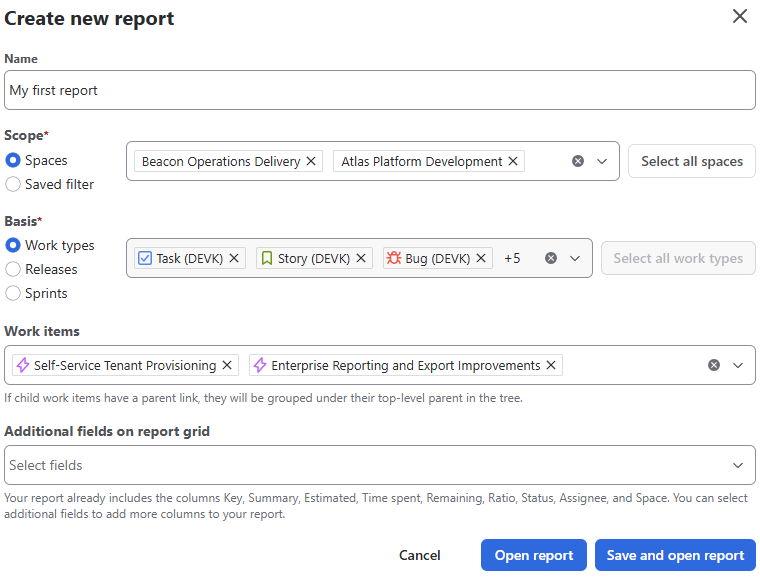
This will open the Report creation window. Below is a breakdown of the fields you’ll need to configure.
Configuring your report
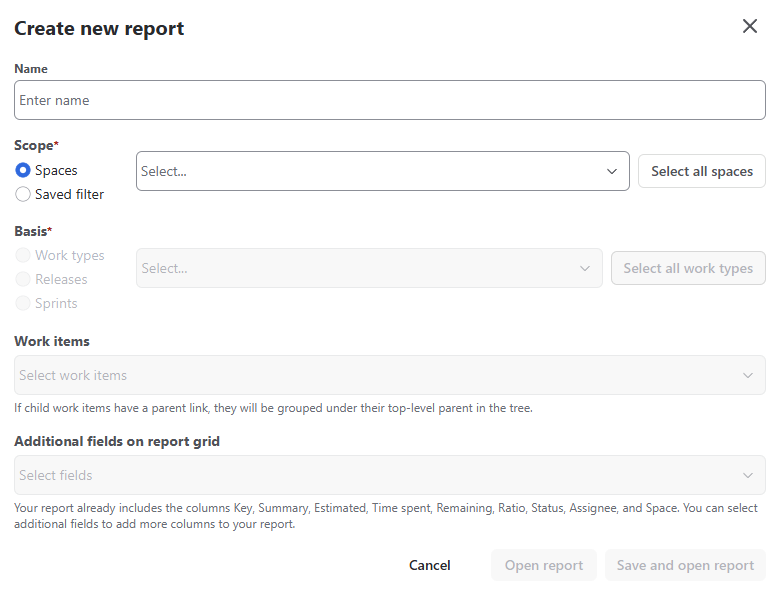
Name
Give your report a clear, concise name. This makes it easier for you and your teammates to identify the report later in the sidebar or management menus.
Scope
You have two primary options for defining the data source:
-
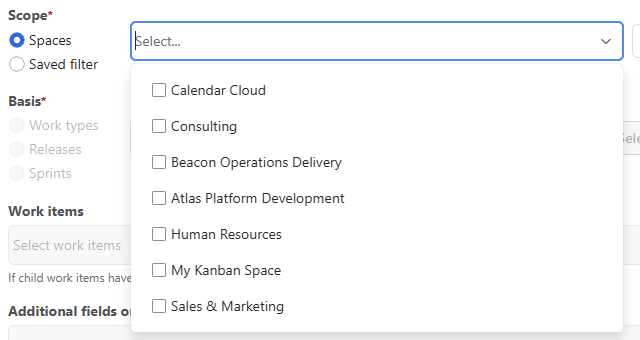
Spaces (Default): Select one or multiple spaces (formerly known as Projects) to include in your report by checking the box next to their names. Choosing this option allows for further granular configuration (see Basis below).
-
Saved Filters: If you choose this option, the Basis and Work items fields will be hidden. You will simply select a pre-configured Jira Filter to pull your data:
Basis
If you are using the Spaces scope, use this field to narrow down your selection. You can base your report on:
-
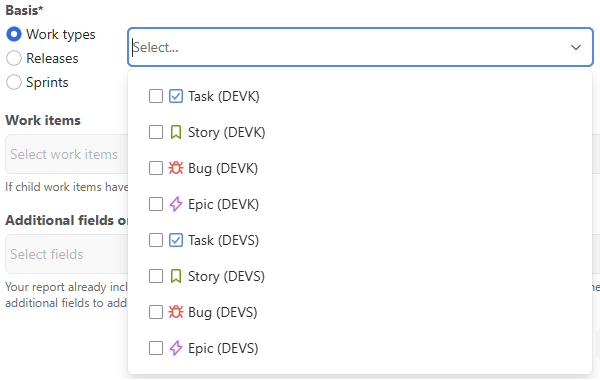
Work Types: Select specific issue types (e.g., Epics, Tasks, Bugs) by checking the box next to their name:
This option works for all calculation modes.
-
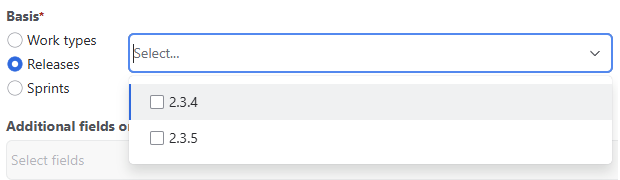
Releases: Choose one or multiple versions. (Selecting this hides the Work items field).
-
Sprints: Choose one or multiple sprints. (Selecting this hides the Work items field).
Releases and sprints scope options do not work for distributive mode.
For more information about calculation modes, please refer here.
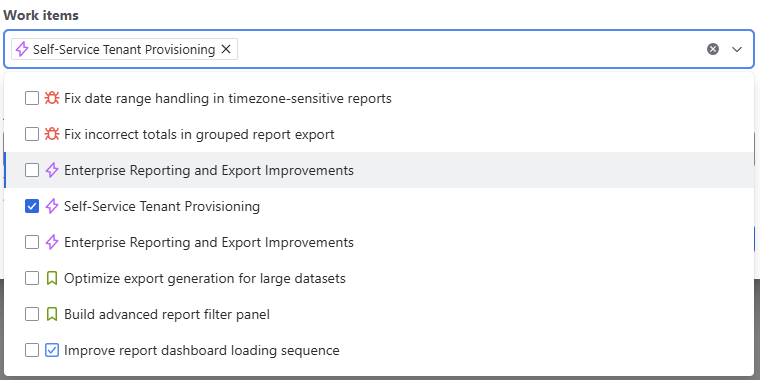
Work items
This field is available if you selected the Spaces -> Work Types configuration. Choose the specific work items required for your report.
Note: If child items have a parent link, they will automatically be grouped under their top-level parent in a tree view once the report is generated. Additionally, choosing a parent work item will automatically include all its child work items in the report.
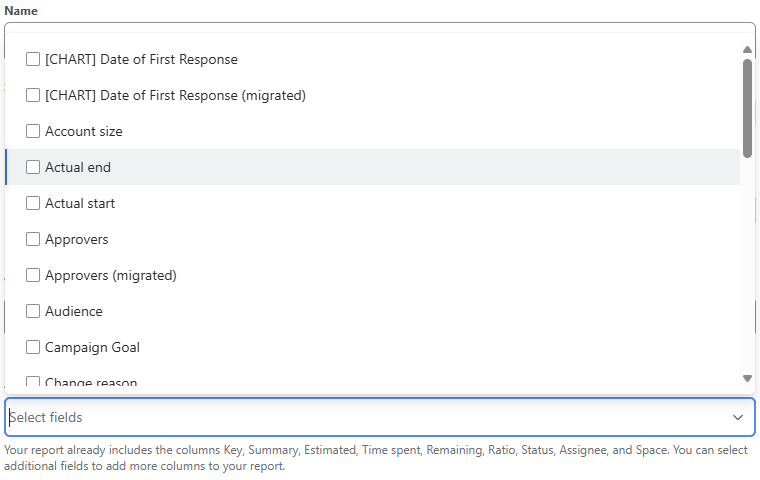
Additional fields on report grid
Customize your data grid by adding extra columns. By default, every report includes:
-
Key, Summary, Estimated, Time Spent, Remaining, Ratio, Status, Assignee, and Space.
Click this field and use the dropdown (technically dropup) menu to select any additional Jira fields you wish to display as columns.
Saving the report
Once you have finished configuring your report, you have two ways to proceed:

Open report
Use this option to load the requested data immediately without adding the report to your sidebar. Choose this for a quick glance at data when you don't want to clutter your Reports panel.
Note: Any configurations made here are temporary. To keep the report for future use, you must click the Save button located in the top-right corner of your screen.

Save and open report
This option immediately saves the configuration to your Reports section and begins loading the data. Choose this when you know you will need to access this specific report again.
Benefit: Once saved, the report is immediately available for future editing via its Settings menu.
Note on Performance:
Depending on the size of your selected spaces and the number of work items, it may take a moment for the data grid to fully populate. Once loaded, you can begin applying temporary filters or exporting your data.
Think you would like to use different scope? Learn how to edit your existing reports here.
Otherwise, let’s dive into analyzing your report data. 🙃
Stay informed
Subscribe to get the latest updates and explore new product capabilities