To use the TeamTime for Jira app effectively, let’s first get acquainted with a crucial term used throughout this manual.
What is a report?
A Report is a user-defined configuration that dynamically pulls information from selected spaces and their work items.
Reports created within TeamTime are dynamic, meaning they automatically update with the latest information every time you open the app. However, our application allows you to filter work logs for specific timeframes. If you need to save a permanent, unchanging snapshot of a report within a specific time period for future analysis or record-keeping, you can export the data as an .xlsx or .csv file.
With that definition out of the way, let’s look at the interface of TeamTime for Jira and its two main components!
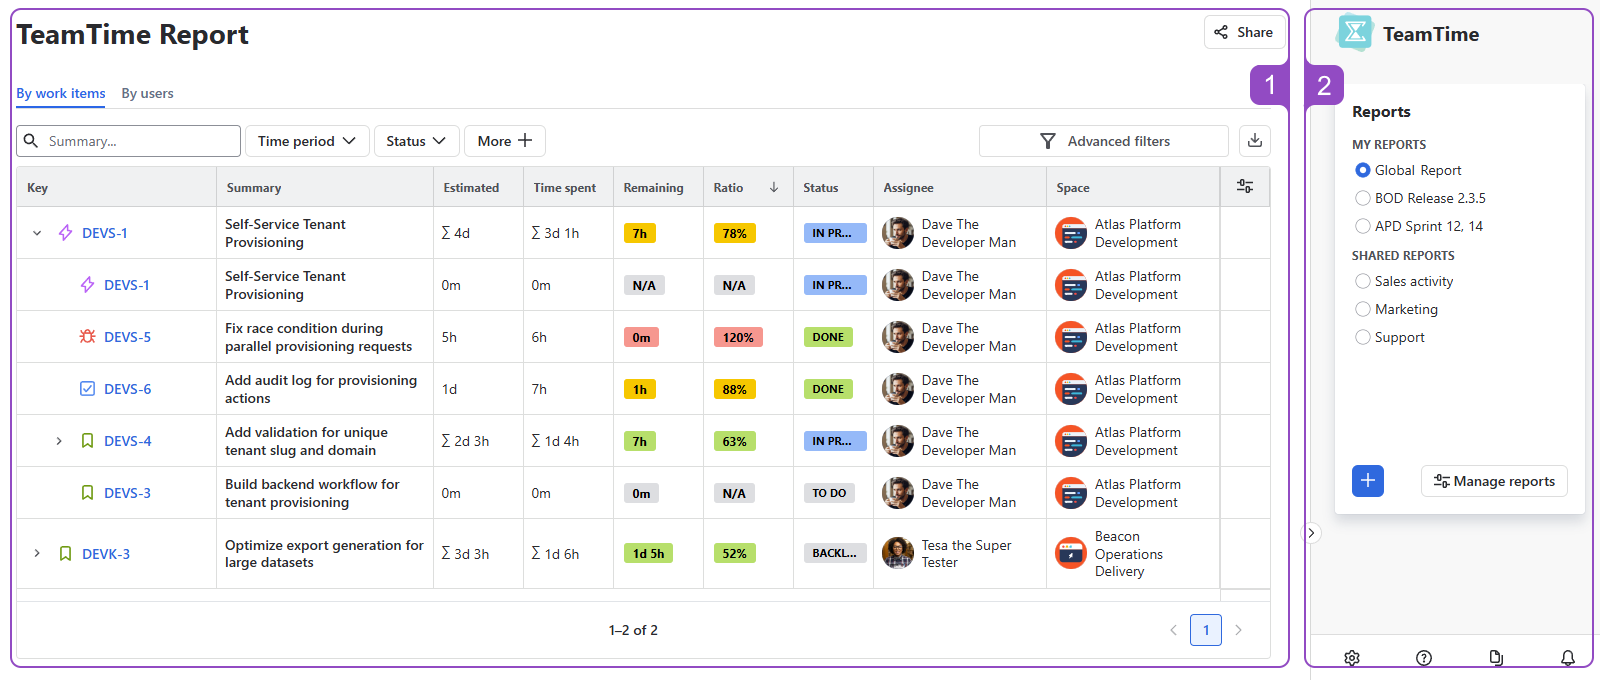
1. Main content area
The Main Content Area is where you view and interact with your reports. When you first open the app, you will be prompted to select an existing report to begin your work.
If no reports are available, or if you need to create a new one, go ahead and move towards the Sidebar description. :)
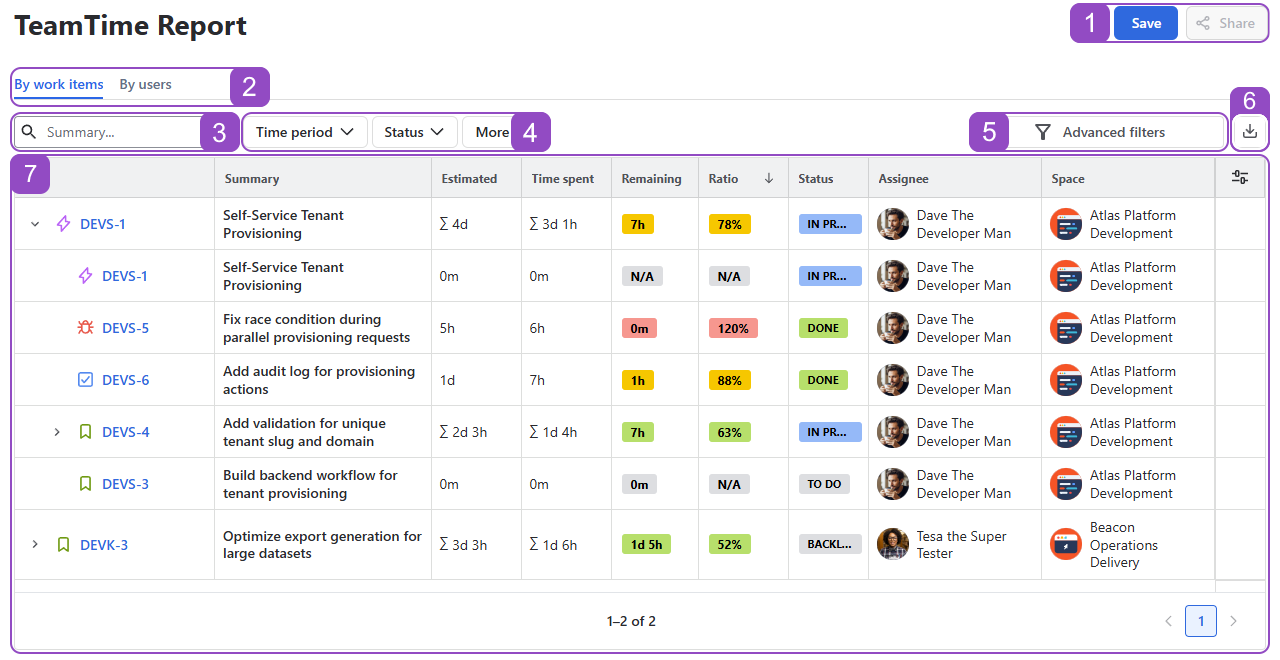
The Main Content Area includes the following key components for interacting with your data, from top to bottom of the interface:
-
Save & Share: Save the report configuration for future use and share it with your team.
-
Grouping tabs: Choose whether to group the report information by work items or by users.
Grouping by users feature is coming in Advanced plan soon!
-
Summary Search: Quickly locate specific work items by entering a text-based query.
-
Quick Filters: Narrow your results using pre-defined, easily accessible parameters for common views.
-
Advanced Filters: Gain full control over your data by applying complex, multi-column criteria for deeper analysis.
-
Export: Capture a permanent snapshot of your current report view as an .xlsx or .csv file.
-
Data Grid: View comprehensive work item details alongside app-specific metrics, such as Estimated Time, Time Spent, Remaining Time, and Ratio.
Understanding Estimated Time Modes
The Main Content Area displays estimated times based on your selected mode: Distributive or Cumulative. You can adjust these preferences in your space’s settings to match your team's tracking style.
For a detailed breakdown of how each mode functions and which one is right for your project, refer to our mode description page here.
2. Sidebar
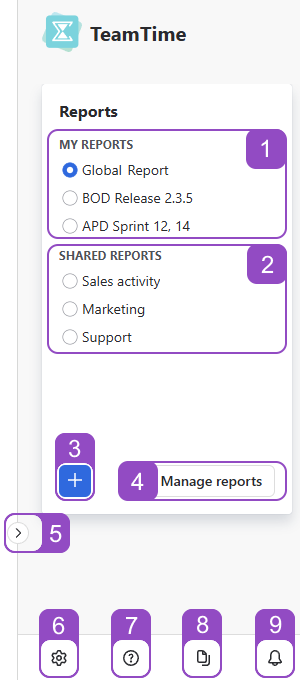
The Sidebar is located on the right-hand side of your screen and acts as the central control panel for the application. It consists of the following components:
-
Your reports: Access your pinned or recently used reports whenever you need them.
-
Shared reports: Utilize the reports configured by your team.
-
Create a new report: Start here to begin the report customization process from scratch.
-
Manage reports: Open this menu to edit existing reports or delete reports you no longer need.
-
Collapse/Expand Button: Click this to hide the sidebar and give your reports more screen space. Click it again to bring the control panel back into view.
-
Settings: Modify the parameters and data sources of the currently active report.
-
Help: Contact our support team, view the full documentation, or participate in a brief user interview to unlock special perks!
-
Report Details: Quickly review the spaces, work types, and work items the current report is pulling from without opening the settings menu.
-
Release Notes: Stay up-to-date with the latest features and improvements added to the app.
With introduction complete, it’s time to get acquainted with TeamTime’s calculation modes and create your first report. :)
Stay informed
Subscribe to get the latest updates and explore new product capabilities