Exporting is a powerful way to capture a snapshot of your report for external analysis, stakeholder presentations, or record-keeping in third-party programs.
Preparing your data for export
Because our export tool is fully synchronized with your current view, we recommend visiting the Analyzing and managing report data page before you begin.
The exported file will reflect your active grid configuration, including:
-
Column Selection: Only the columns you have enabled in the configuration menu
will appear in the file. -
Applied Filters: Only the rows currently visible in your grid will be exported.
-
Time period filters: Use the date picker to create specific day, week, or month-based snapshots of your data.
-
Sorting: The row order in your file will match the sorting priority you’ve set in the UI.
How to Export
The export process is designed to be quick and intuitive.
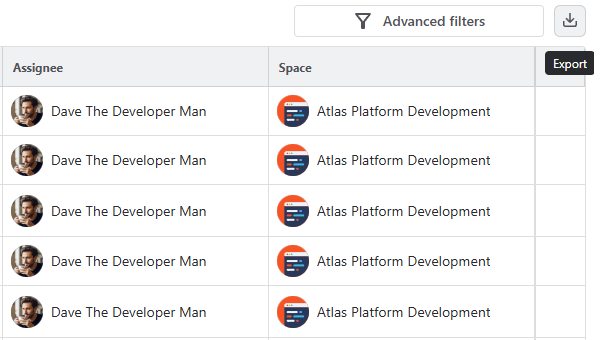
Locate the Export button in the top-right corner of the data grid:
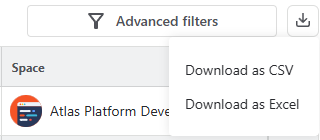
Click the button to reveal a dropdown menu with two format options: .xlsx and .csv.
Choosing the Right Format
Not sure which one to pick? Here are the best use cases for each:
|
.xlsx (Excel) |
Human Readability |
Choose this if you need to send a progress report to a manager. It preserves basic formatting and is ready for immediate use in Microsoft Excel or Google Sheets. |
|
.csv (Comma Separated) |
Data Processing |
Choose this if you are importing the data into another tool (like Tableau, PowerBI, or a custom database). It is a lightweight, raw data format that machines read easily. |
Select your preferred format, and the download will begin automatically.
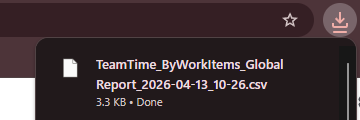
Note: For very large reports, the generation process may take a few moments. Once complete, the file will be available in your browser's downloads folder.
Congratulations, your report is now exported!
Stay informed
Subscribe to get the latest updates and explore new product capabilities