Use case description: A project manager opens an epic or a higher-level work item that represents a feature or initiative and needs to quickly understand its overall progress.
This includes:
-
total estimated effort
-
total time spent
-
remaining work
-
progress across all related issues;
In Jira, this information is distributed across multiple levels of the work item hierarchy, making it difficult to get a clear and reliable overview in one place.
Calculation mode: Cumulative.
Current Jira setup and its limitations
Jira provides several ways to view work item data, but they are limited when working with hierarchical structures:
-
Child issues panel: Displays only direct child works and does not reflect the full hierarchy. Has limited column visibility: only a small number of fields can be displayed at once, restricting insight into key metrics.
-
System aggregation fields (Σ): Provide basic rollups, but are not flexible enough for real-world planning and reporting scenarios. They only count direct child work items.
-
Fragmented data: Users often need to navigate across multiple work items to understand total effort and progress.
As a result, gaining a complete view of work requires manual effort and context switching.
What TeamTime provides
TeamTime delivers a unified view of effort directly within the Jira issue:
-
A full hierarchy view of all related issues
-
Automatic aggregation of estimates and logged time across all levels
-
Calculated remaining time and progress ratio
-
A detailed breakdown showing how each issue contributes to the total.
How it works
-
Open the work item you need to check the progress for.
-
Quickly have a look at TeamTime custom fields, which display isolated info about current work item:
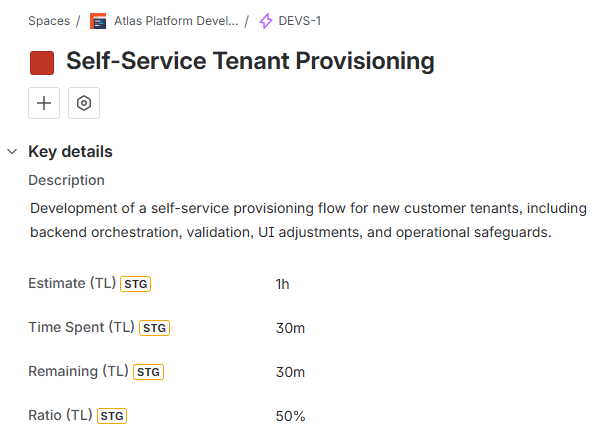
More about TeamTime’s custom fields here.
-
Navigate to the TeamTime’s app section for the detailed info in child work item context:
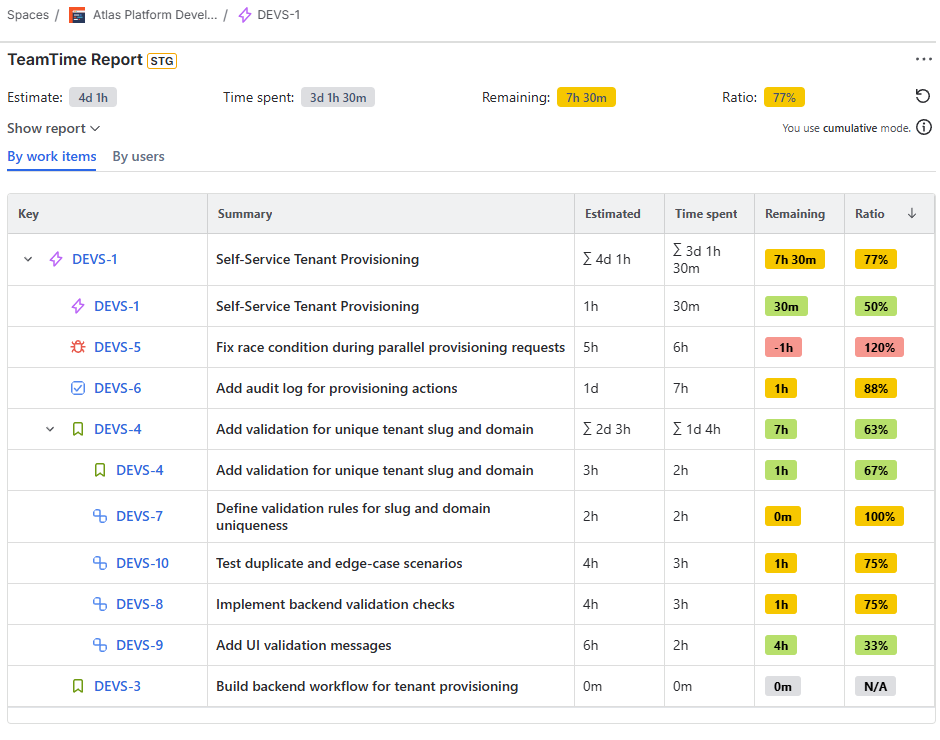
The top row of the report represents the combined values of the selected work item and its entire hierarchy, while the detailed rows provide full transparency into the calculation.
Result
Project managers and team leads can:
-
Understand total effort and progress at a glance
-
Eliminate manual aggregation and navigation across issues
-
Make informed decisions based on complete and accurate data.
Stay informed
Subscribe to get the latest updates and explore new product capabilities