.png)
Reports
As the CRM app concept considers using Jira issues as sales (read more), you can take full advantage of sticking to regular dashboards with their gadgets. What kind of reports you can get using CRM and basic Jira functionality? Following are several examples.
Reports based on CRM gadgets
Use the Issue Groups Statistics gadget that allows you to browse the sum of values of numeric fields for issues grouped by a parameter.
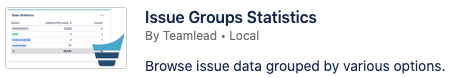
Select a scope of issues (a saved filter) to be displayed
Select which issue field should be set as a group (for instance, you can group by status/assignee/resolution and basically by any "select-list-alike" field)
Select the numeric fields to get their values summed up for a group and overall for the scope.
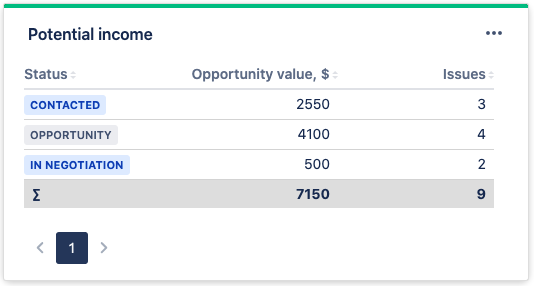
Potential Income
It's nice to know how much value the upcoming sales may bring to you. Create a filter for your potential sales (probably all ones that are not in Lost/Won statuses). Select a Number field where you keep the potential income value for summing up.
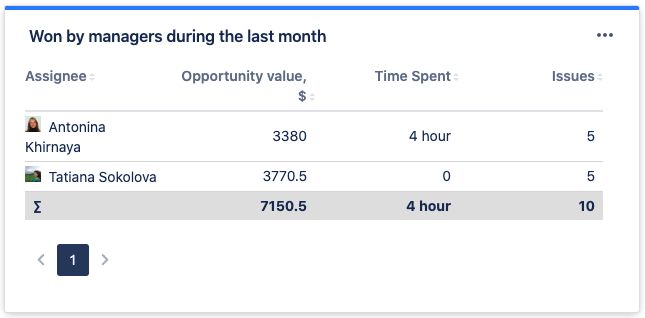
Lost/Won income by a manager during a period
You might like to know how much a particular manager won or lost during, for instance, the previous 12 months. Create a filter for sales that were won or lost during the required period (~ status changed TO won DURING startOfYear()). Select the Assignee field as a grouping one and the numeric field that containing income value for summing up. You can also display some else additional statistics for each group such as work logs.
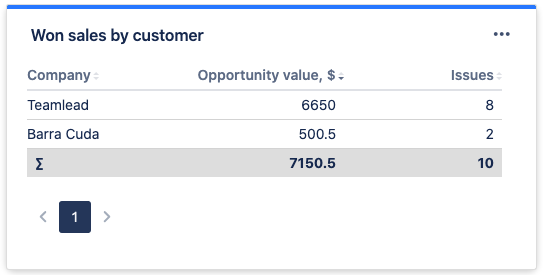
Main customers
Get statistics of the CRM customers and income they brought to you for all times or for a particular period. Create a filter for sales and group it by the Company field. Select a numeric field with the income value. Use sorting to align the income from the greatest to the minimal one.
Reports based on standard gadgets
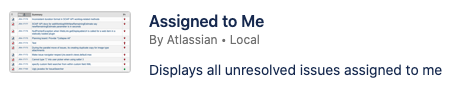
My active sales
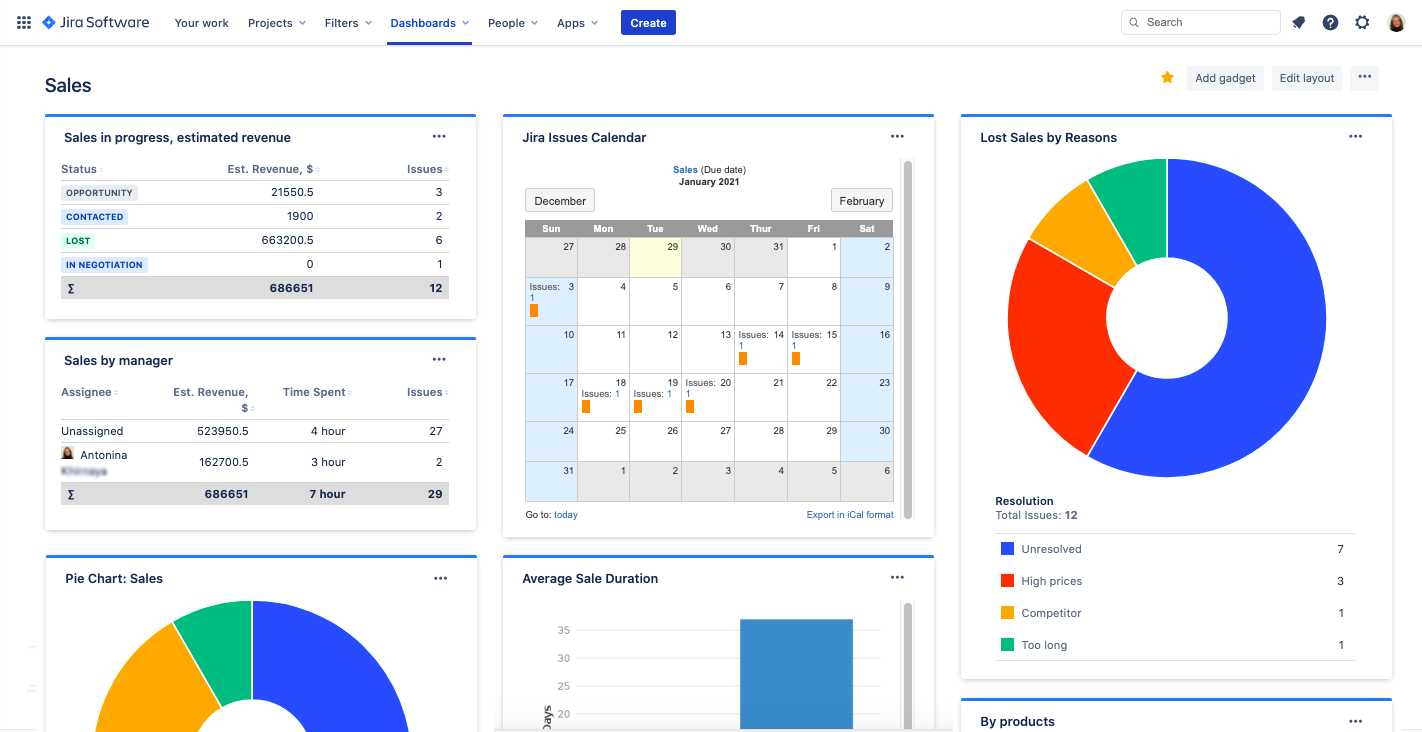
Use the standard Assigned to me gadget to display our current sales on a dashboard. Set unresolved sales as the scope of issues and add set up displaying of fields like Customer, Revenue, Probability, etc.
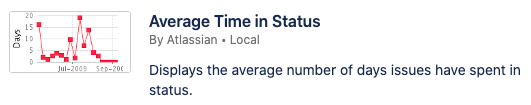
Average time in the funnel stages
Use the standard Average time in status gadget to see how much time in average your sales spent in each status (=funnel stage).
Popular sales types
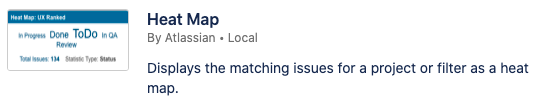
Use the standard Heat map gadget to browse the most popular categories of your sales. Chose labels in case you don't have the defined list of categories. The labels field allows you to tag your sales as you need.
Lost sales reasons
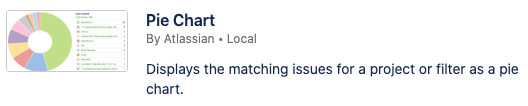
Use the standard Pie chart gadget to browse the most typical reasons for losing sales. Select the lost sales as the scope and Resolution as a target field.
Sales and managers
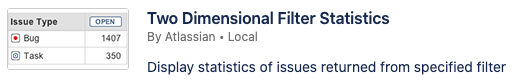
Use the standard Two-dimensional filter statistics gadget to browse the statistics of your sales distribution between managers. Select our sales as the scope of issues, sale stages as the X-axis and assignees as the Y-axis.